Overview
iFridge is a desktop grocery management application to encourage home cooks to manage their food waste. The user interacts with it using a CLI, and it has a GUI created with JavaFX.
My role in the project was to implement the feature for users to keep track of their statistical food waste, so that they can see how they are performing in food waste management and seek efficient ways to reduce their food waste. Apart from writing code, I maintained the User Guide, Developer Guide and project GitHub repository.
Summary of contributions
-
Major enhancement: added the ability for the user to keep track of his or her food wastage statistics
-
What it does: This feature allows the user to keep track of all previous food waste up to the current point. Some notable extensions include generating a food waste report which showcases a historical trend of food waste by specifying a time frame, as well as predicting the user’s estimated food waste for the current month.
-
Justification: This feature improves our product significantly by allowing the user to monitor his or her food waste, which aligns with our application’s aim to encourage users to find effective ways to reduce food waste.
-
Highlights: The enhancement required an in-depth planning on how to store the past food waste. This is because there is a need to keep track of the temporal aspects of the food waste (in particular, when the food was wasted). To facilitate the implementation of this feature, the architecture of some components have to be newly designed from scratch, and the multiple options to do so had to be carefully considered and assessed. When implementing the waste-related classes, there is a need to acquire a deep and broad understanding of how the different components worked together.
-
-
Minor enhancements:
-
Added support for the user to view his or her waste list for a specific month. This feature is implemented with the intention of allowing users to see which types of foods they tend to waste more often by checking their past waste lists.
-
Added support for flexible parsing of months when the user chooses to specify the starting and ending months to generate a waste report.
-
-
Code contributed: The samples of my functional and test code can be viewed here.
-
Other contributions:
-
Project management:
-
Managed milestone
v1.3on Github -
Refactored package names: #141
-
-
Documentation:
-
Community:
-
Tools:
-
Contributions to the User Guide
As we morphed the product, we kept the user guide up to date with the features we implemented. Below is an excerpt of my notable contributions. |
Waste List Management
Moving an item into waste list
When you delete an item from your grocery list using delete, the item will automatically be
moved into the waste list if it has not been fully used (the amount of food remaining > 0).
Viewing the waste list: wlist list
Shows a list of the food items which have been wasted
Format: wlist list [m/MONTH_OF_YEAR]
Examples:
-
wlist list
This will list out the current month’s waste list. -
wlist list m/sep 2019
This will list out the waste list for the month of September 2019, if such a record exists in our waste archive (i.e. you have opened our application in the month of September 2019).
Displaying food wastage statistics: wlist report
Shows a charted report detailing your food wastage statistics across a time frame.
Format: wlist report [sm/START_MONTH] [em/END_MONTH]
Examples:
Suppose we have a waste archive with data from Oct 2018 to Oct 2019 (current month).
-
wlist report sm/Mar 2019
Generates a waste report from Mar 2019 to the current month of Oct 2019. -
wlist report sm/Mar 2019 em/Sep 2019
Generates a waste report from Mar 2019 to Sep 2019 -
wlist report sm/Mar 2018
Generates a waste report from Oct 2018 to Mar 2019 (one year from Mar 2018) -
wlist report sm/5 months ago
Generates a waste report from May 2019 to Oct 2019 (current month)
Using the waste report
-
After a successful waste report command, there will be 3 charts displayed in different tabs, one for each of the following:
-
Weight of food wasted (in kg) across the time frame
-
Volume of food wasted (in litres) across the time frame
-
Quantity of food wasted (in units) across the time frame
-
Our charts are interactive, you can get more details about your food wastage by interacting with our charts.
-
Zooming on the chart: If you want to zoom in on a specific region of the graph, you can use your mouse to click and drag on the preferred window.
-
To retrieve more specific details on the food wastage for a particular month, you can choose to:
-
click on the particular point in the chart, which will bring up the grid guidelines, or
-
click on the month name in the horizontal axis, which will zoom in on the exact wastage details for that particular month.
-
-
Returning to the original window: You can easily return to the original window by clicking on the title of the chart.
Below is an example of a waste report with the chart on food wastage in kg:
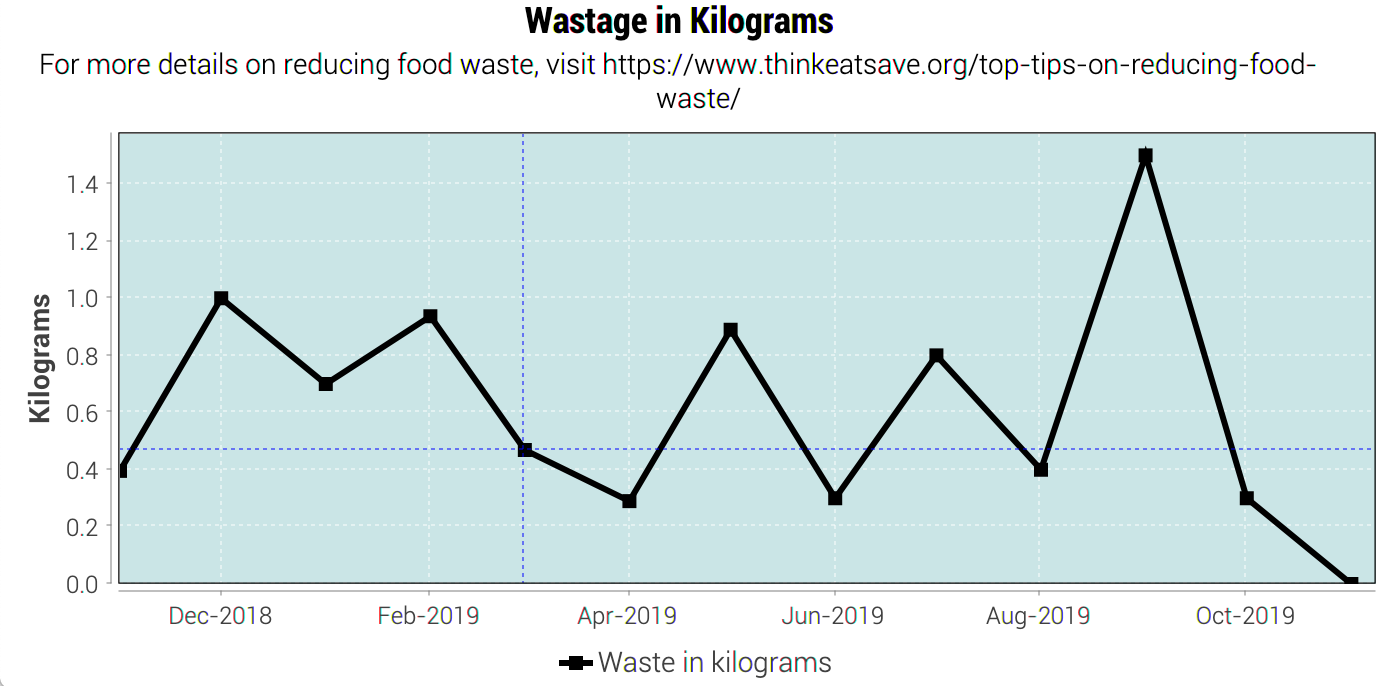
By clicking on the data point which lies on "March 2019", we can see that our food wastage for Mar 2019 is around 0.45kg.
Obtain feedback based on current food wastage: wlist feedback
Format: wlist feedback
Our prediction algorithm:
We first interpolate your current month’s waste statistics to arrive at an estimate. Following which,
we take a weighted average of your waste statistics across the past couple of months to provide you with
a more reliable prediction.
As with any other application, our prediction algorithm will be more accurate with more frequent usage.
Contributions to the Developer Guide
We also kept the Developer Guide updated so that potential developers and enthusiast users could better understand the design and implementation of our app. To illustrate my contributions to the Developers' Guide, I have once again only included the more notable excerpts. |
Model component
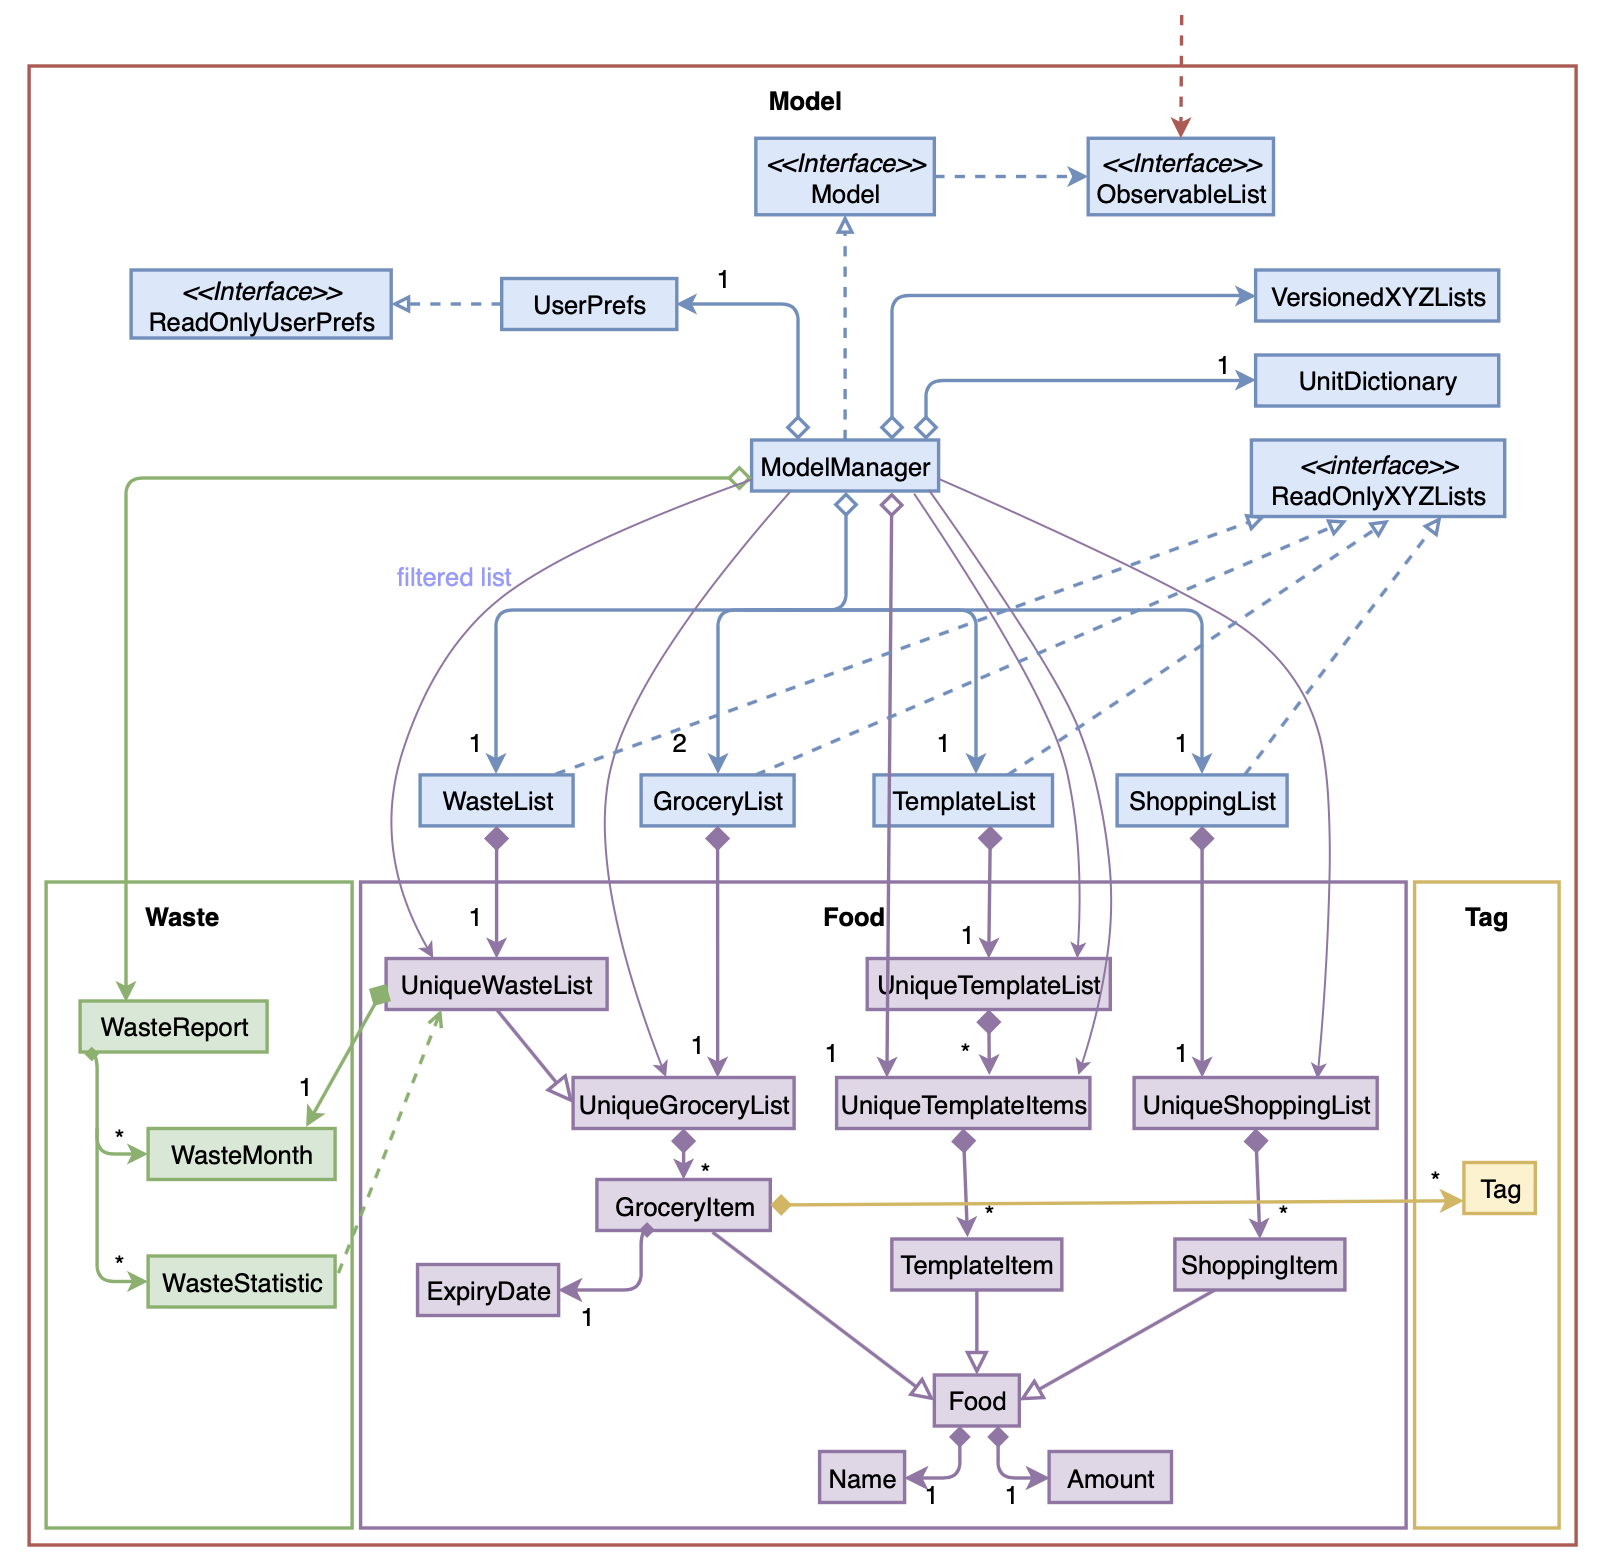
Notes regarding the class diagram:
-
XYZ refers to the different lists used in our model - waste list, grocery list, template list and shopping list.
-
The curved arrows emanating from the
ModelManagerclass all refer to filtered lists.
API : Model.java
The Model,
-
stores a
UserPrefobject that represents the user’s preferences. -
stores the data for the different lists: WasteList, GroceryList, TemplateList, ShoppingList.
-
exposes unmodifiable
ObservableListfor all the different lists so that can be 'observed' e.g. the UI can be bound to this list so that the UI automatically updates when the data in the list change.
To enhance the OOP-design of our architecture, we abstracted out a separate food class to cater to the different requirements of separate lists.
For instance, shopping lists require its food items to have additional attributes which indicates the urgent and bought status.
|
Waste Report Feature
Implementation
The wlist report feature allows users to generate a graphical report of their food wastage performance.
We illustrate below our method of implementation.
Support for flexibility of months
By allowing the user to specify a start and an end month, thorough checks are implemented in the
WasteReportCommand#execute method to identify the best suited time frame:
-
After the
WasteReportCommandParser#parsesuccessfully provides the user-specified start and end months inWasteMonthobjects, the following checks are performed:-
starting month cannot be later than ending month
-
starting month cannot be after current month (latest record in waste archive)
-
ending month cannot be before earliest waste record
-
-
Upon passing the checks, the we proceed to refine the actual start and end months as follows:
-
Starting month will be the later of the specified month and the earliest record found in the waste archive. This is achieved with the use of the
WasteMonth#earliermethod. -
Ending month will be the earlier of the specified end month and the current month (latest record in waste archive). This is achieved with the user of the
WasteMonth#latermethod.
-
This completes the first part on checking for a valid range of months.
Generating the report
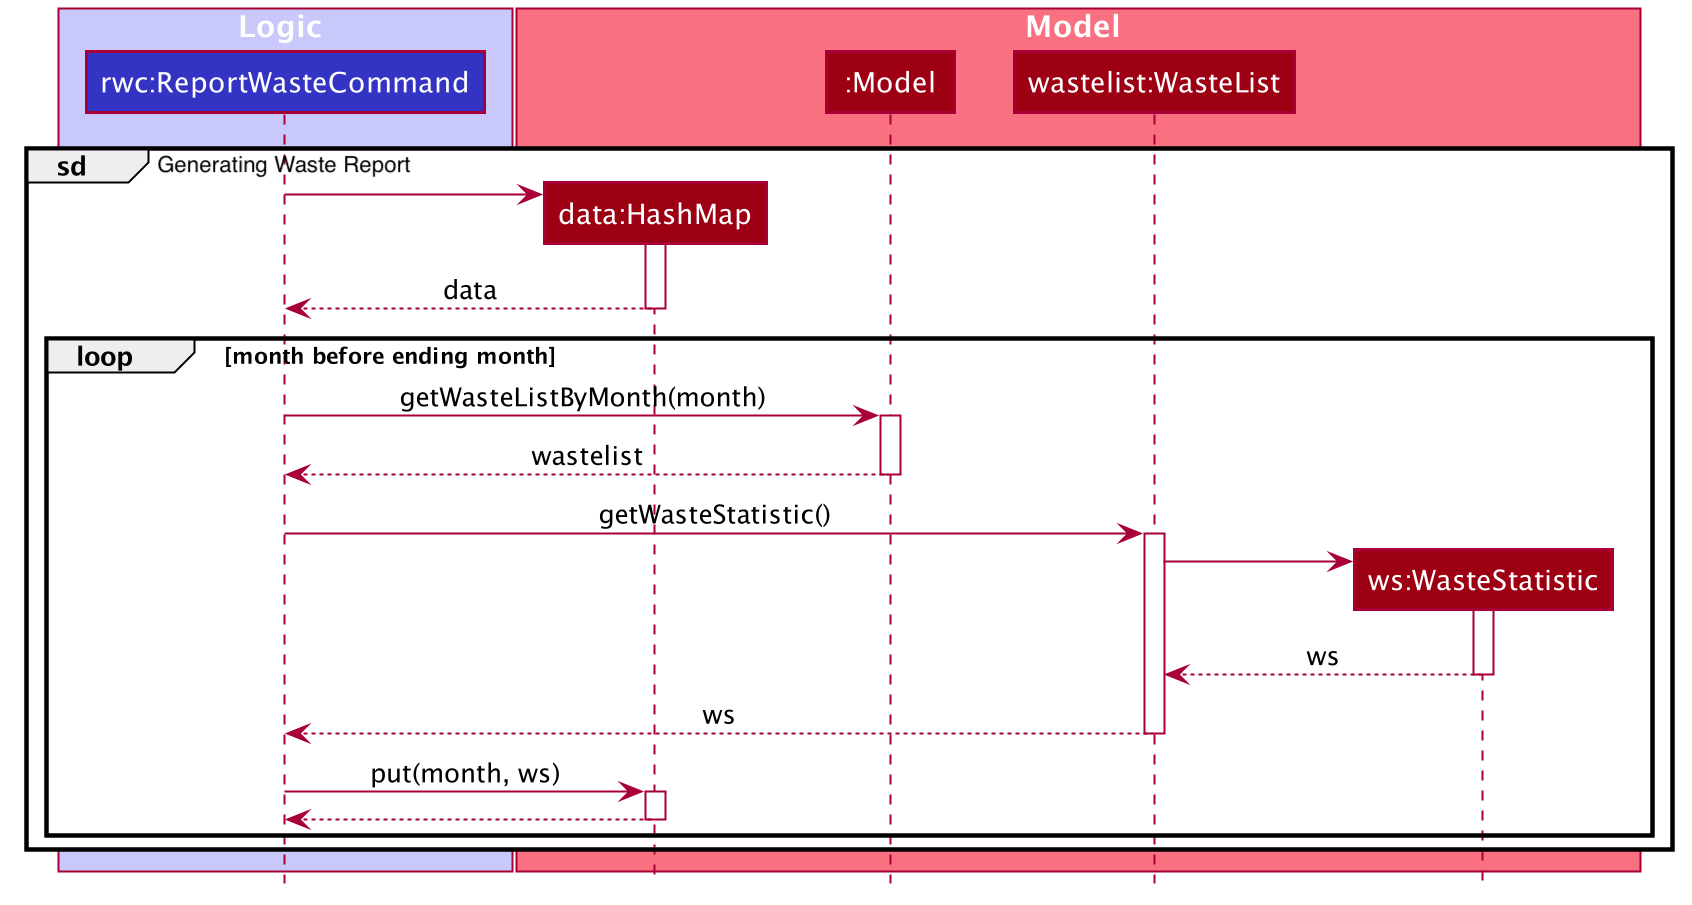
Under WasteReportCommand#execute, when iterating through the months from the starting month to
the ending month:
-
We first retrieve the relevant
WasteListfor the month usingModel#getWasteListByMonth(WasteMonth) -
Thereafter, we obtain a
WasteStatisticobject, which contains the weight, volume and quantity of food wasted for the given month by callingWasteList#getWasteStatistic.-
Note that the
WasteList#getWasteStatisticmethod is a wrapper method to calculate the waste statistics. The actual computation of the statistics for the given waste list is done in theWasteStatistic#getWasteStatisticstatic method, which takes in aUniqueWasteListand calculates the statistics by iterating through the list.
-
-
Collect the data by storing it in a
HashMapindexed by the month (aWasteMonthobject) with the correspondingWasteStatisticas the value. -
The data collected in the
HashMapis used to initiate aWasteReportobject, which will then be passed back to the model, along with the respectiveCommandResultobject.
You may find the following activity and sequence diagrams helpful.
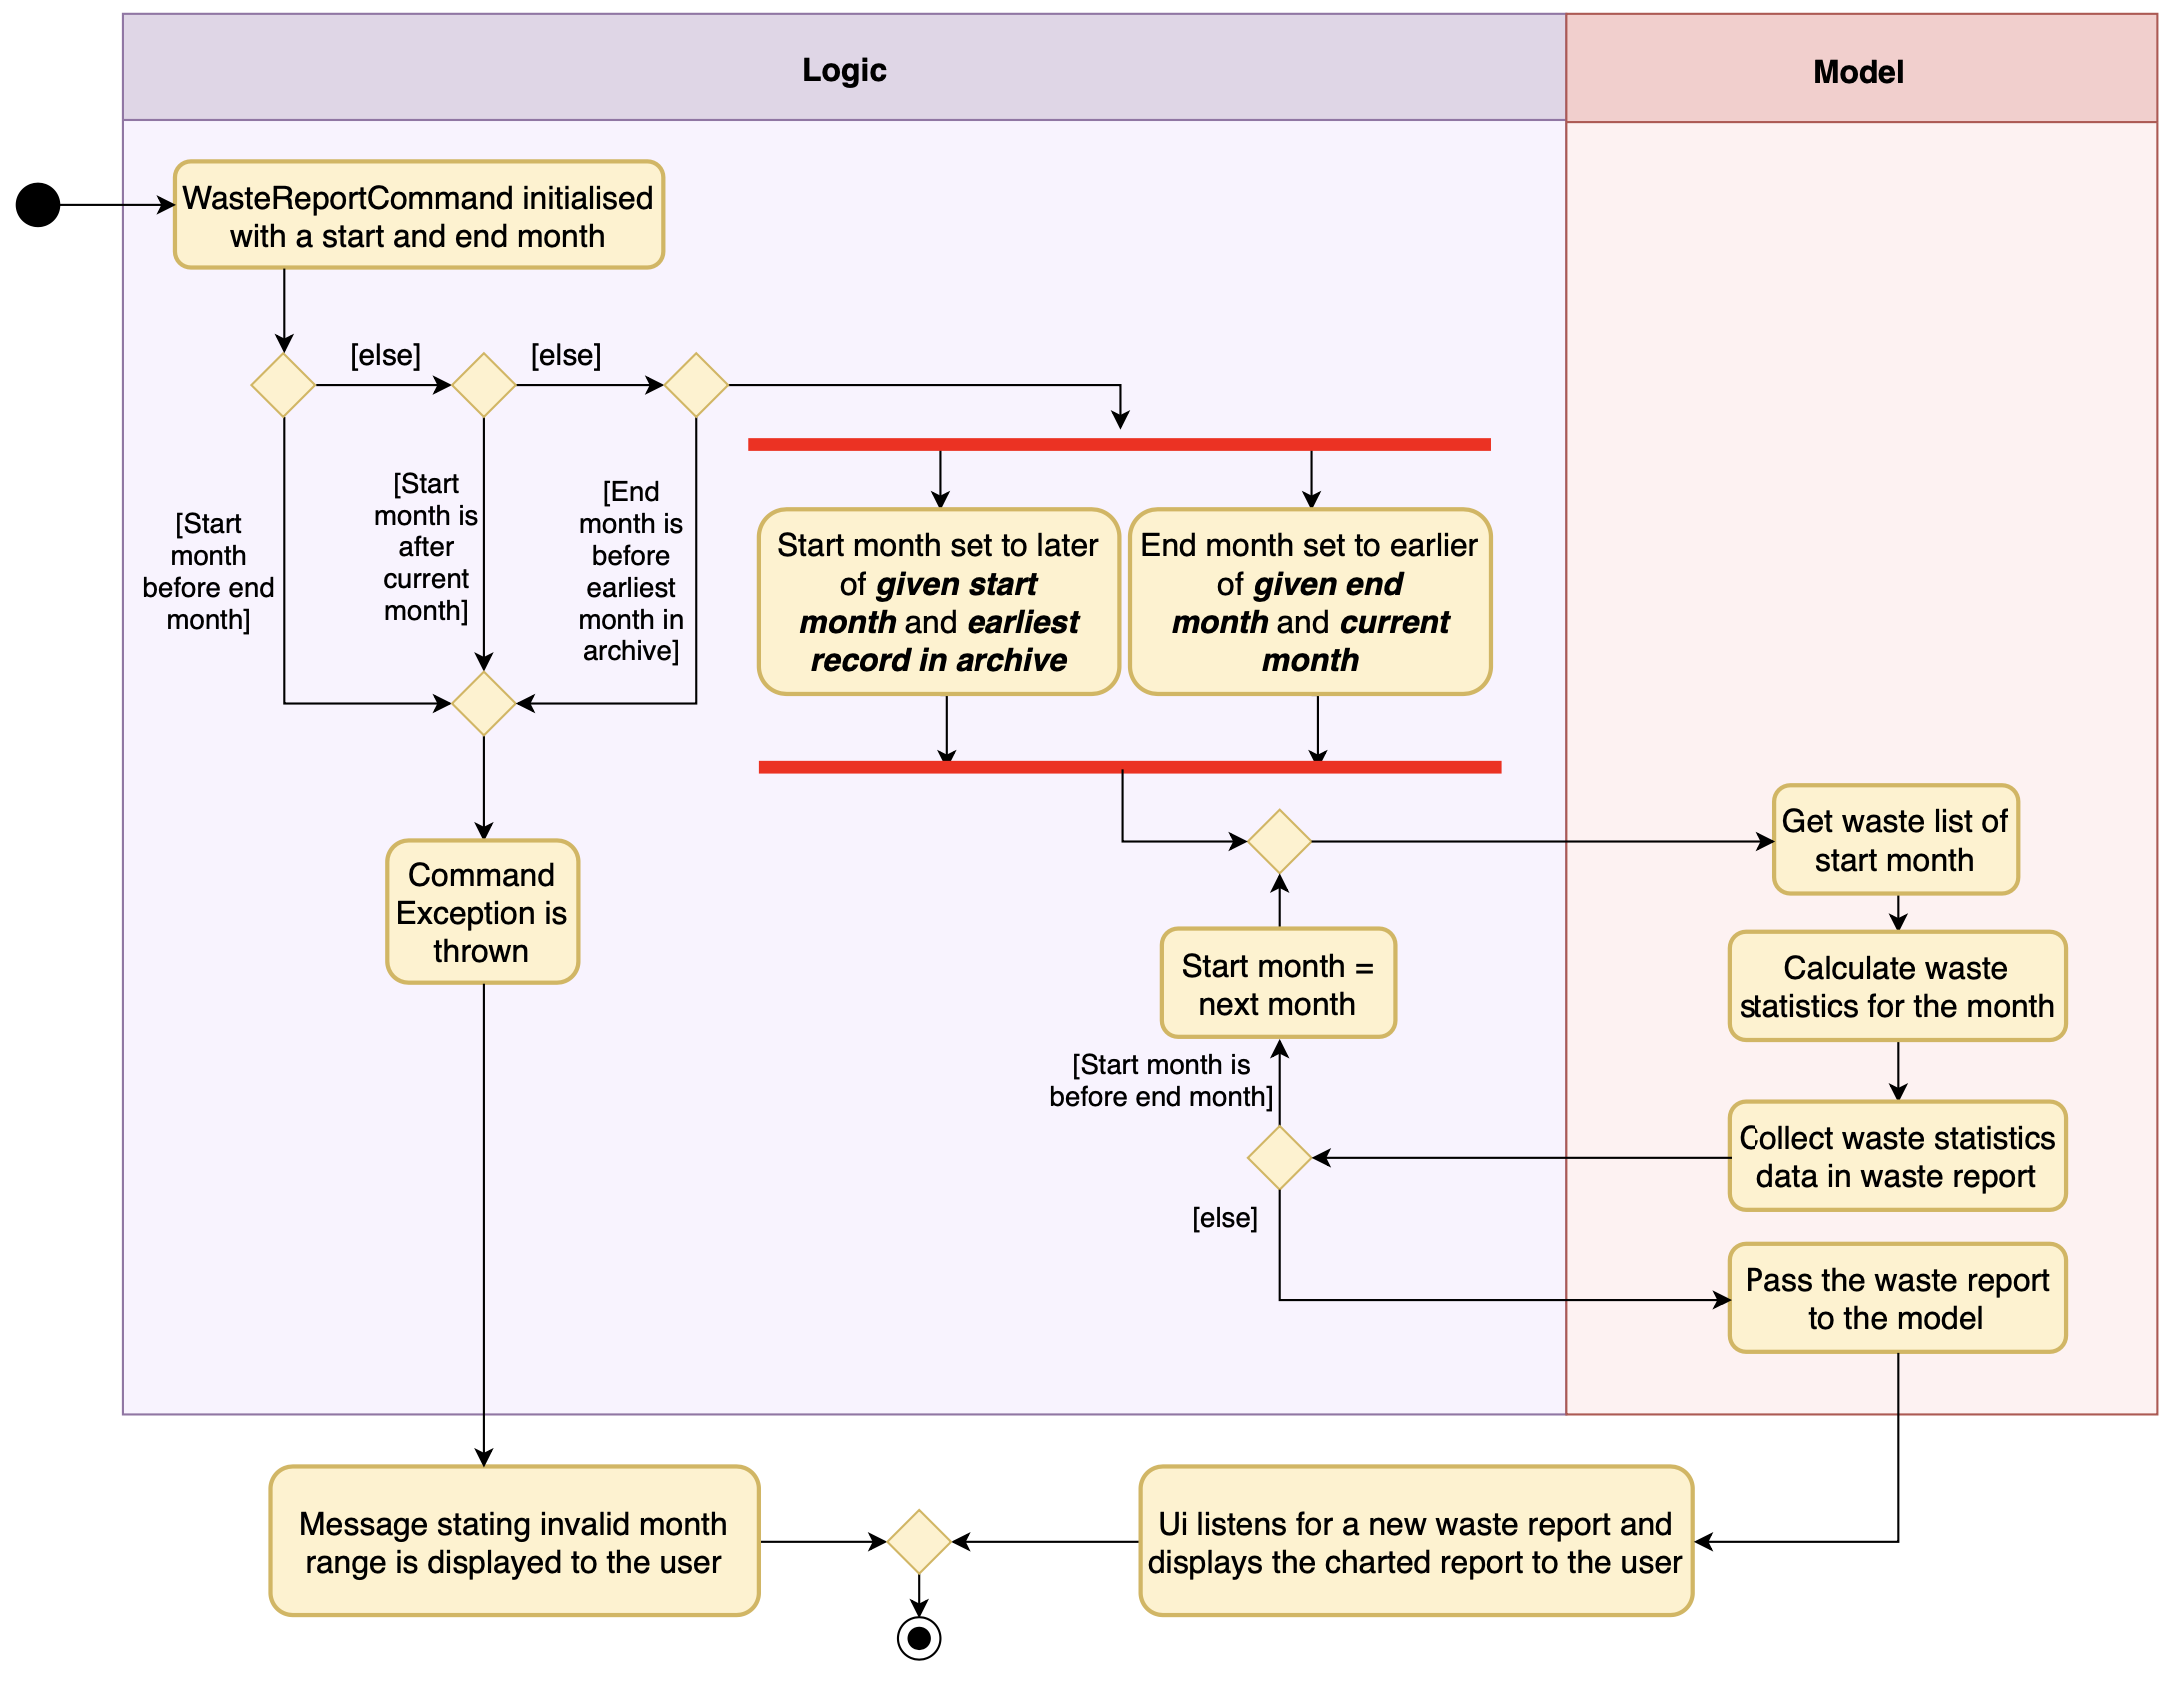
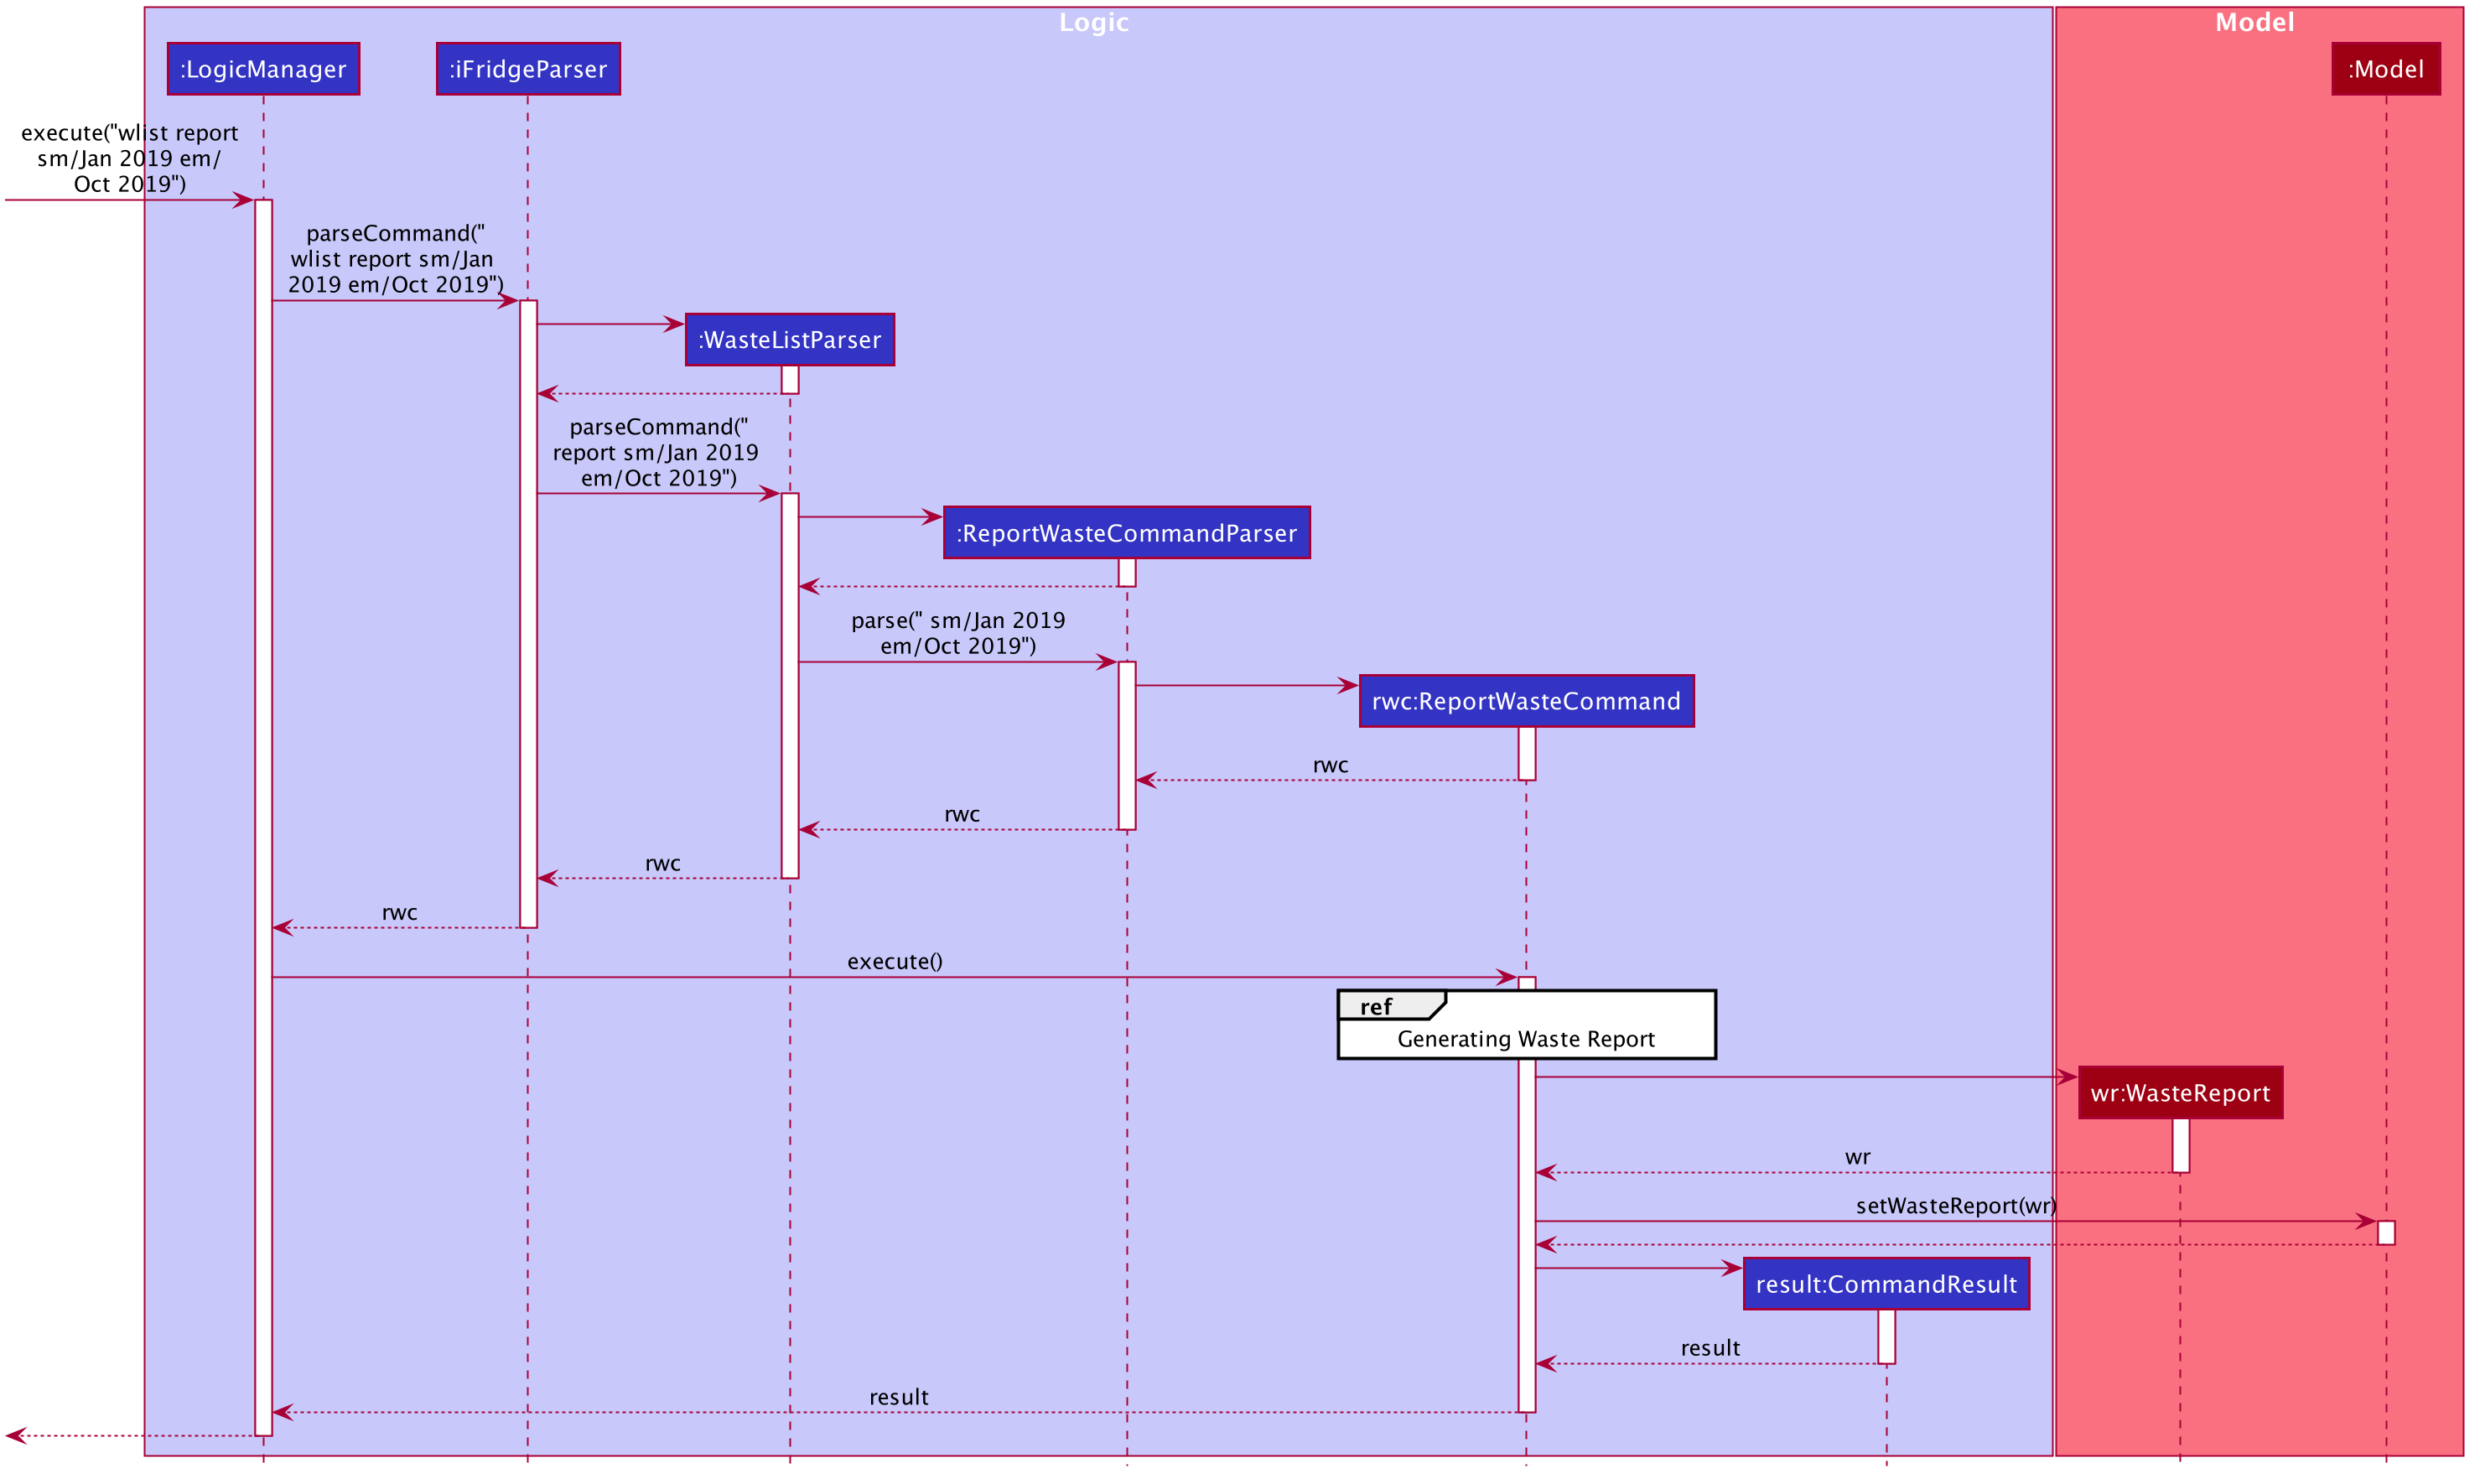
In summary, the activity diagram below illustrates what happens when a command to generate a waste report is entered.
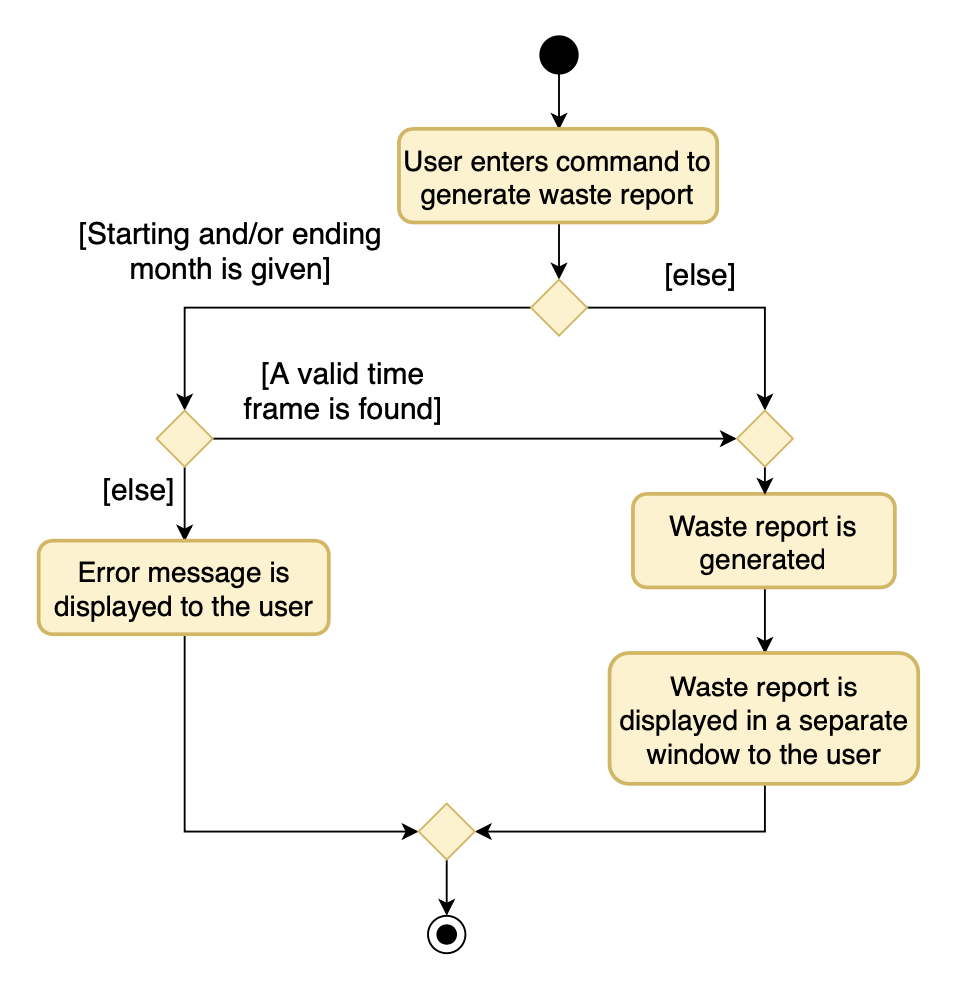
Refer to our user guide to see what constitutes a valid time frame.
To complete the big picture, we have included a class diagram to illustrate the key components pertaining to implementing statistical waste list features.
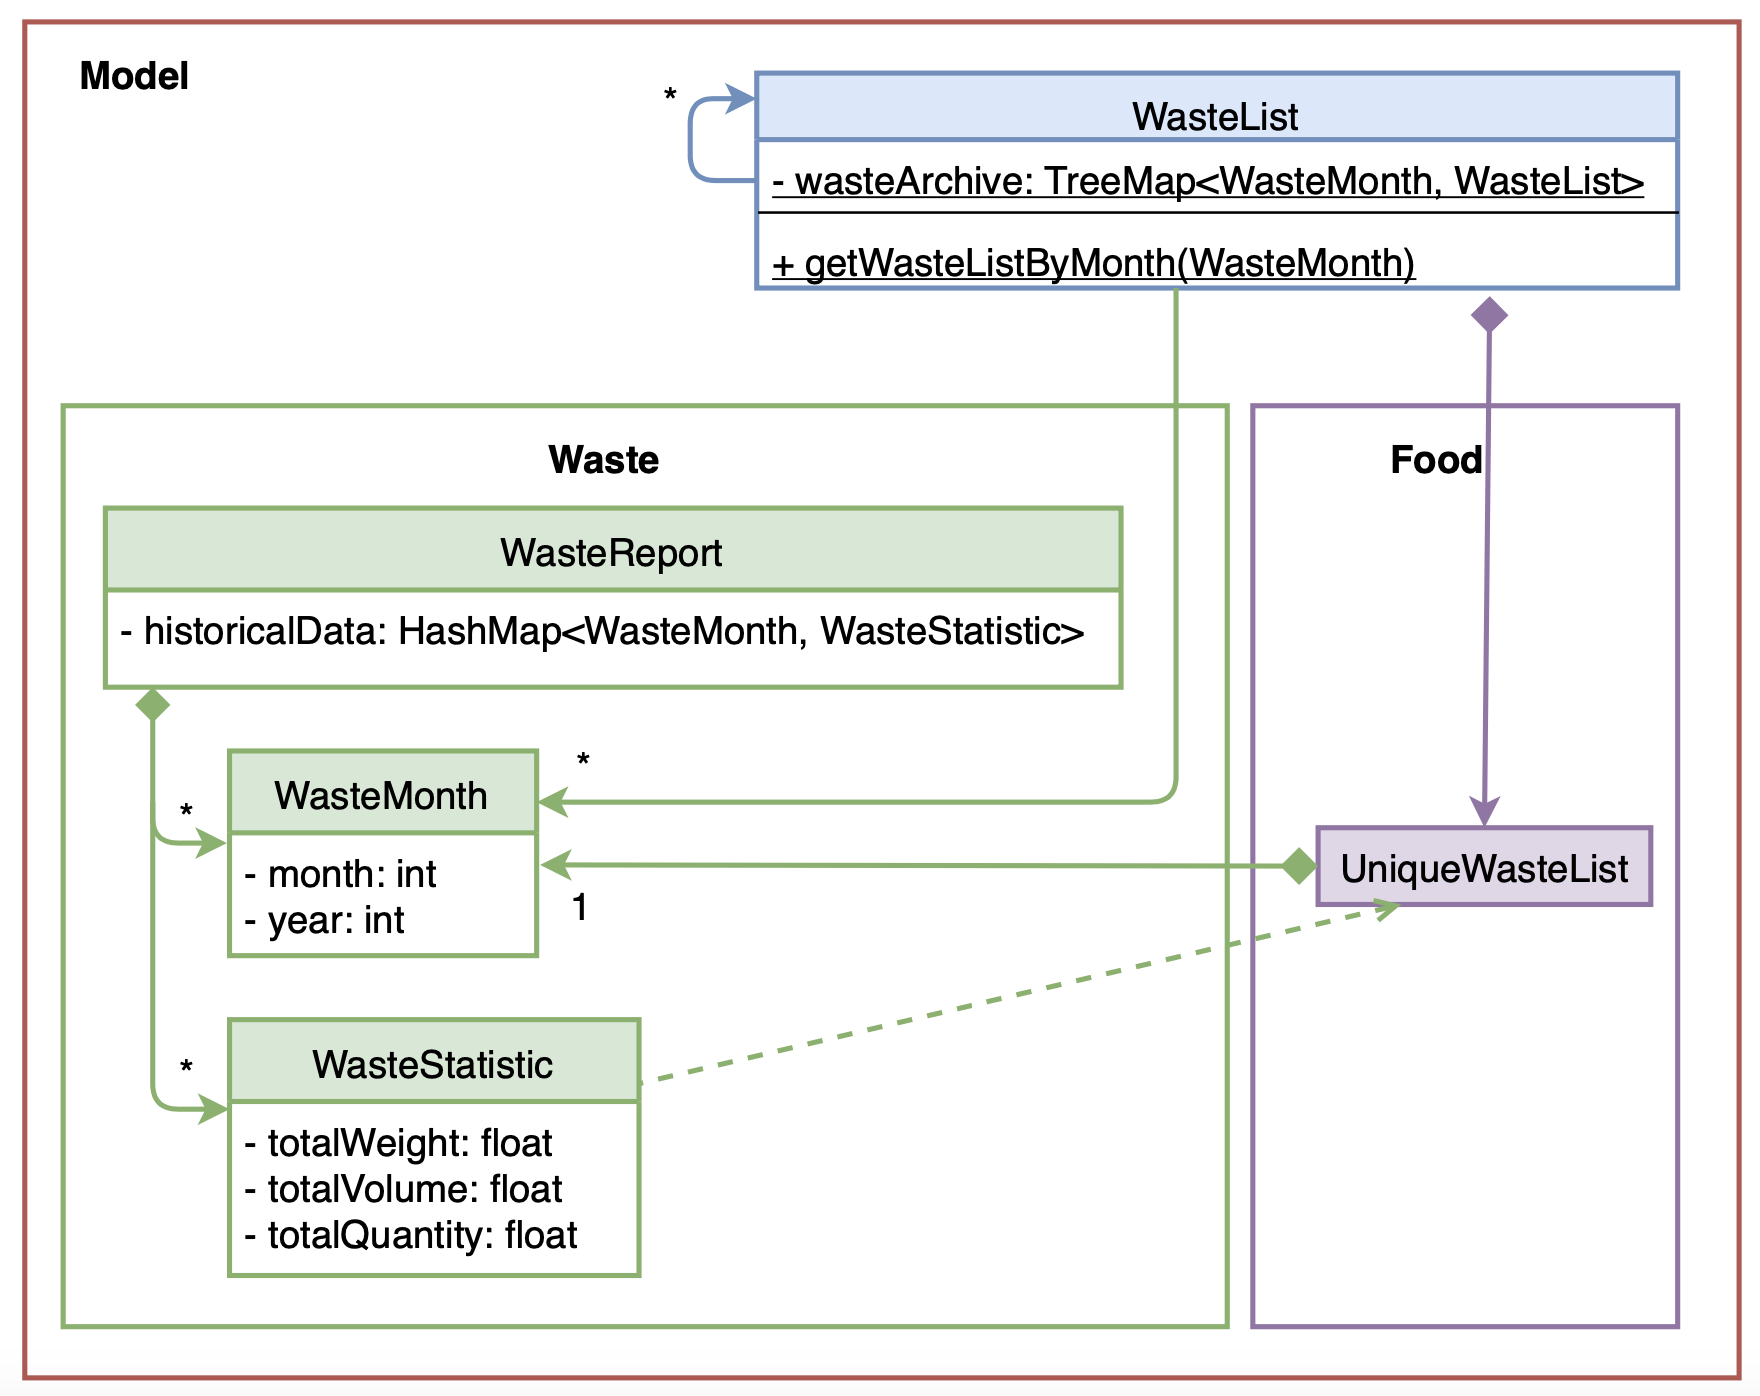
Our waste archive is stored as a static member of the WasteList class, in the form of a TreeMap.
|
Possible Alternative Implementations
-
Alternative 1 (Chosen implementation)
Go through the waste archive to retrieve the grocery items in the waste list for the past months and calculate the waste statistic for each month.
-
Pros: This is a fail-proof way of ensuring the waste statistics are accurately computed every time.
-
Cons: The runtime is linear in terms of the total number of grocery items found across all waste lists in the waste archive. With a growing waste archive, it will take longer to generate the report.
-
-
Alternative 2
Since the waste statistics for the previous months are unlikely to change, they can be stored externally and loaded upon launch of the application, instead of calculating every time the waste report command is executed.
-
Pros: Will improve the runtime of the application.
-
Cons: Will take up more storage space. Additionally, this does not guard against the event that the user modifies the external storage files which may cause the waste archive and the statistics to be synced incorrectly.
-
Waste List Manual Testing
-
Moving an item into the waste list
-
Prerequisites: List all grocery items in the grocery list using the
glist listcommand. The item must exist in the grocery list, and has not been fully consumed (i.e. amount = 0). -
Test case:
glist delete 1
Expected: First grocery item is deleted from the list. Details of the removed grocery item shown in the status message. If item has been fully consumed, it will be permanently removed from iFridge.
-
-
Listing out the waste list for a particular month
-
Prerequisites: Waste list must exist in waste archive.
-
Test case:
wlist list
Expected: The tab for the waste list is shown and is updated to reflect all waste items for the current month. -
Test case:
wlist list m/sep 2019
Expected: The tab for the waste list is shown and is updated to reflect all waste items for the month of September 2019, if such a waste list exists in the waste archive. -
Test case:
wlist list m/last month
Expected: The tab for the waste list is shown and is updated to reflect all waste items for the last month, if such a waste list exists in the waste archive. -
Test case:
wlist list m/invalid
Expected: Error message for invalid command displayed. -
Other invalid test cases:
wlist list m/Decemer 2019. More details on valid or invalid date formats can be found in our user guide.
-
-
Obtaining predicted food wastage for the current month
-
Test case:
wlist feedback
Expected: Message box displays the current and predicted food wastage. -
You are free to modify the json file
wastearchive.jsonto see how our feedback feature performs differently. The estimated food wastage is predicted by taking the weighted average of waste statistics using (at most) the four most recent waste lists.
-
-
Generating a waste report
-
Test case:
wlist report
Expected: iFridge will display a window with 3 charts detailing food wastage statistics. It will attempt to generate a waste report from one year ago till the current month (e.g. if the current month is Nov 2019, it will attempt to generate a report from Nov 2018 to Nov 2019) with sufficient data. If there is insufficient data, it will only display the records starting from the earliest month found in iFridge’s waste archive. -
Test case:
wlist report sm/5 months ago
Expected: iFridge will attempt to generate a report using data from 5 months ago to the current month.
We have a detailed section in our User Guide on the specifications of the starting and ending months along with their expected behaviour -
Test case:
wlist report sm/next month
Expected: Error message displayed suggesting that the start month cannot be later than the current month. -
Test case:
wlist report em/Sep 1990
Expected: Assuming we have no data for the month of Sep 1990, an error message will be displayed suggesting that there is no valid data in the time frame. It also indicates to the user what the earliest record in the waste archive is. -
Other invalid test cases:
wlist report sm/Oct 2019 em/Jul 2019,wlist report sm/in 12 weeks
-
